Brain Tumor AI
An MRI classification demo that compares a baseline CNN with an EfficientNet-B0 attention model, adds MC Dropout uncertainty scoring, and shows model focus through Grad-CAM.
The key idea is simple: do not just output a class. Show the prediction, show the confidence, show the uncertainty, and show where the model looked so the result can be interrogated rather than blindly accepted.
Predictions are paired with confidence and attention.
The demo helps a reviewer understand what the model predicted, how stable that answer is, and where the model focused inside the scan.
Baseline control plus a stronger interpretable model.
The project compares a scratch CNN against EfficientNet-B0 with attention, MC Dropout, and Grad-CAM rather than presenting one isolated result.
Streamlit front end over a shared inference engine.
The application wraps PyTorch inference, uncertainty scoring, charts, and visual evidence inside one browser-based diagnostic demo.
Medical AI credibility is visual and statistical.
A classifier is easier to judge when uncertainty, comparison, and visual evidence are all kept in the same interface.
One case-study page for beginners, developers, and evaluators.
This version is clear at first glance, technically grounded on second read, and deep enough for serious portfolio review.
An MRI demo that predicts, explains, and shows its confidence.
This project takes a brain MRI, classifies it into one of four classes, shows how confident the system is, and overlays a heatmap so the user can see where the model focused.
A full demo surface around a dual-model inference engine.
The Streamlit interface sits on top of a shared PyTorch inference engine that loads two models, standardizes preprocessing, compares outputs, and generates Grad-CAM overlays.
A diagnostic AI project with controls, uncertainty, and visible evidence.
The project is intentionally comparative: a baseline CNN provides the control, while EfficientNet-B0 with attention, MC Dropout, and Grad-CAM adds stronger evidence around the prediction.
The project is designed to explain the answer, not just return it.
That makes the page consistent with the rest of your portfolio while still preserving the research identity of this case study.
The research is wrapped in a real user-facing application.
These screens come from the real Streamlit project and show how the demo behaves in use rather than living only in slides.
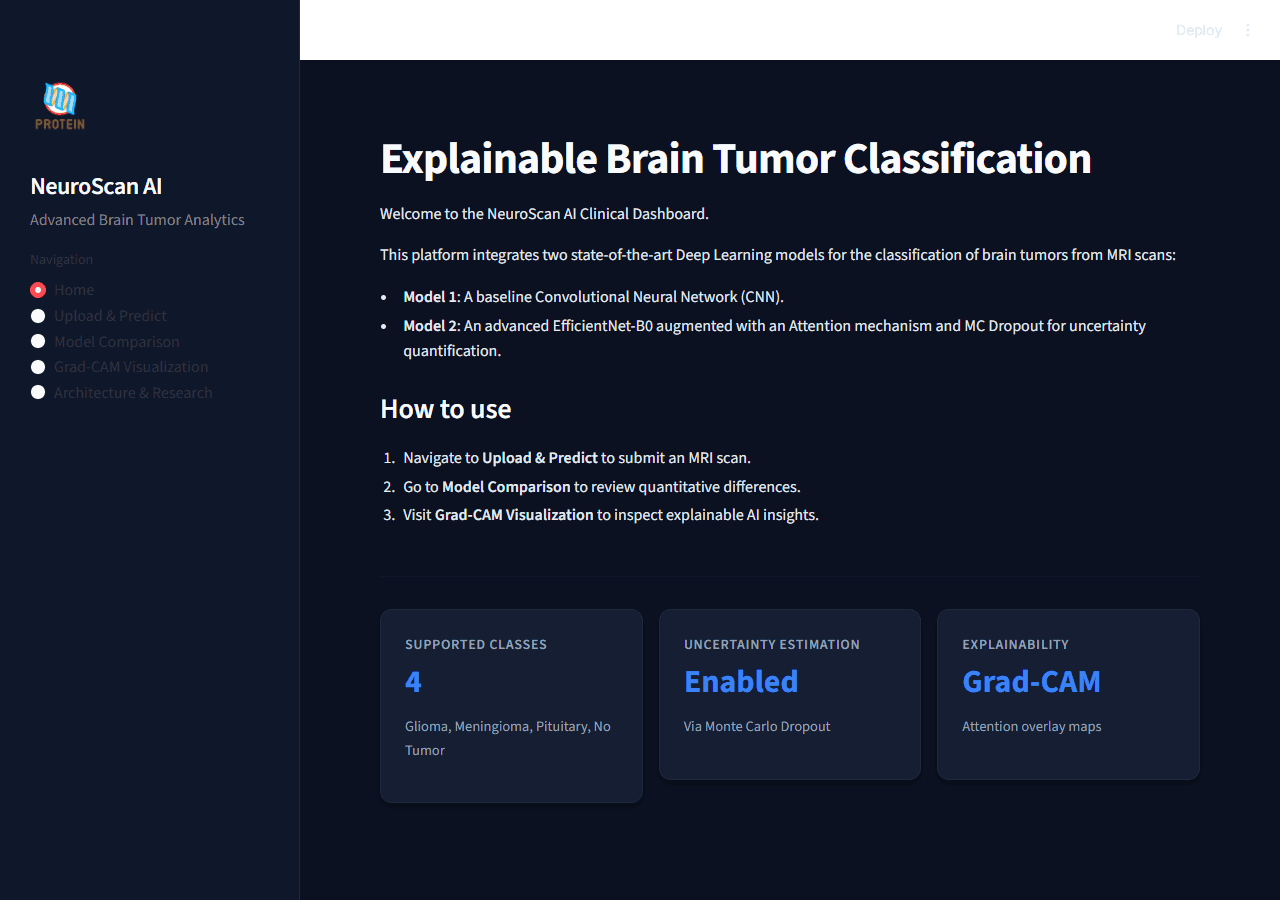
Clinical Home Dashboard
The home screen presents the project as a diagnostic dashboard where confidence and visual evidence matter as much as the class label.
Live Model Comparison
Both models run in one comparison view so confidence, probabilities, and speed can be checked side by side instead of in separate notebooks.
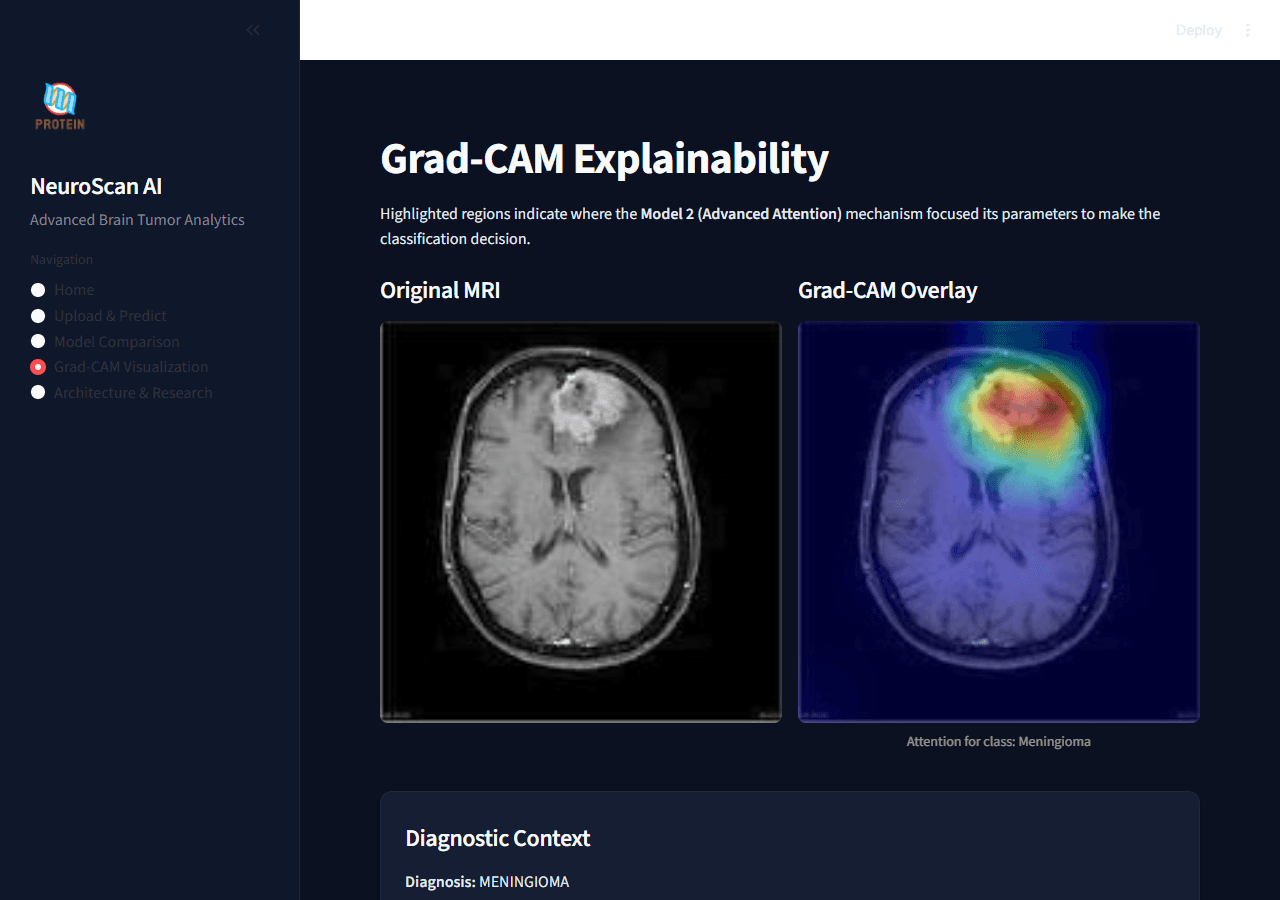
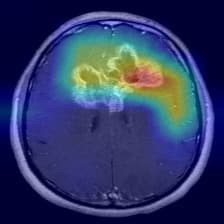
Grad-CAM Visualization
The Grad-CAM screen makes model attention inspectable, which is one of the most important checks in a medical AI demo.
Balanced data, two architectures, one clearer comparison.
This section groups the dataset framing, model design, and implementation choices so the research logic is easier to absorb.
Model 1 | Baseline CNN
Model 2 | EfficientNet-B0 + Attention
From MRI upload to interpretable prediction.
This animated sequence is grounded directly in the real Streamlit app and inference engine, so the portfolio page mirrors the actual runtime behavior.
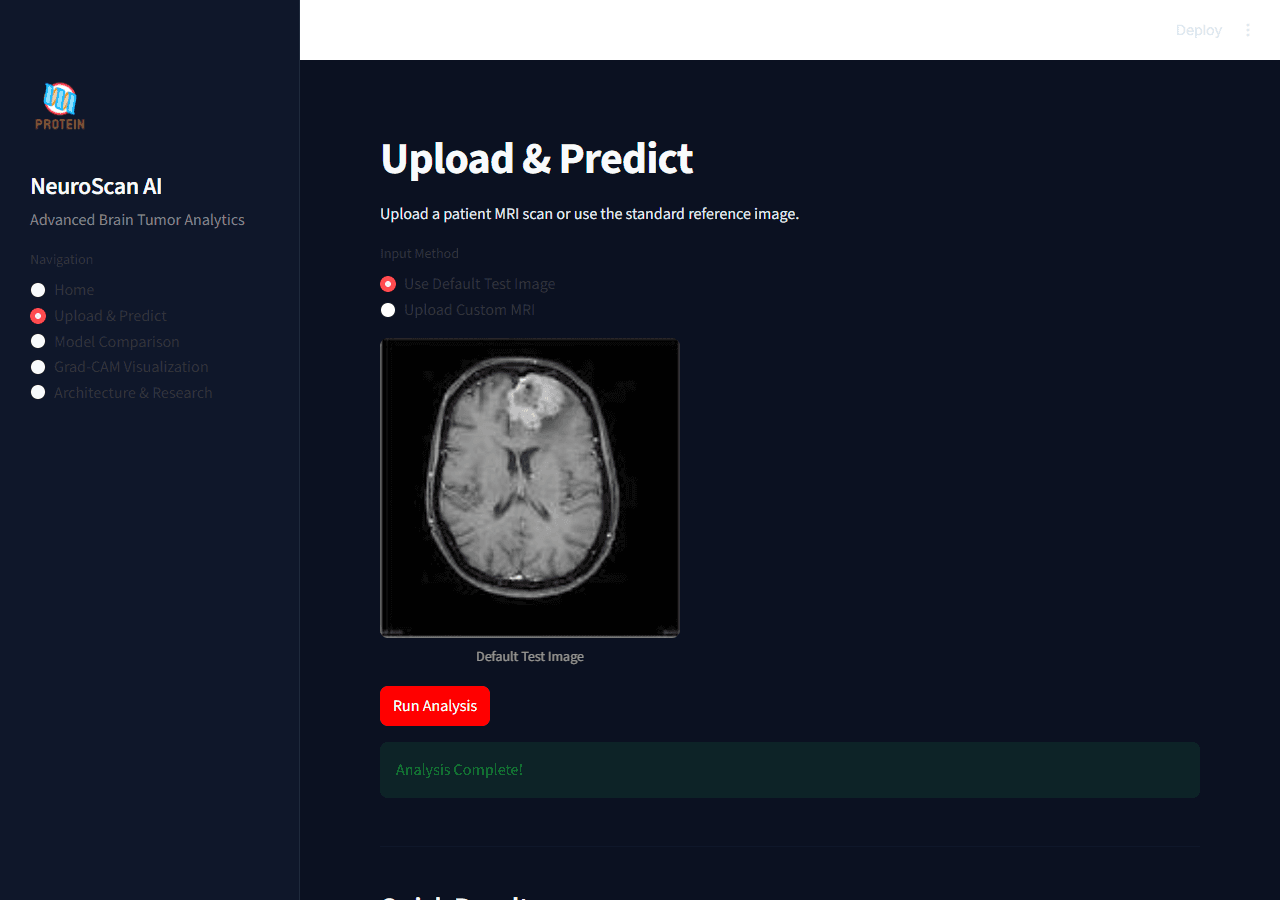
The demo begins in a real dashboard, not a notebook cell.
The user can upload a custom MRI or use the default test image, which makes the experience accessible to reviewers who are not running Python code themselves.
How the demo is made and why it feels credible.
This section keeps the same structure as the DoctorCopilot page while staying specific to the research and computer vision work behind Brain Tumor AI.
Demo Interface
Streamlit provides the clinical dashboard with navigation for Home, Upload & Predict, Model Comparison, Grad-CAM Visualization, and Architecture & Research.
Inference Engine
A shared engine loads both models, standardizes preprocessing, times inference, computes probabilities, and keeps result state reusable across screens.
Model Stack
PyTorch powers a scratch CNN baseline and an EfficientNet-B0 attention model, letting the project compare simple and advanced strategies in one application.
Explainability Layer
Probability distributions, uncertainty bands, training plots, confusion matrices, ROC curves, and Grad-CAM overlays make the model easier to inspect instead of leaving it opaque.
The live demo intentionally keeps classification, uncertainty, probability charts, and Grad-CAM in the same experience. That is what makes the project feel more credible in both product and research terms.
Metrics, plots, and visual proof all stay visible.
The page keeps the underlying research evidence on screen instead of hiding it behind a repo link or a one-line accuracy claim.
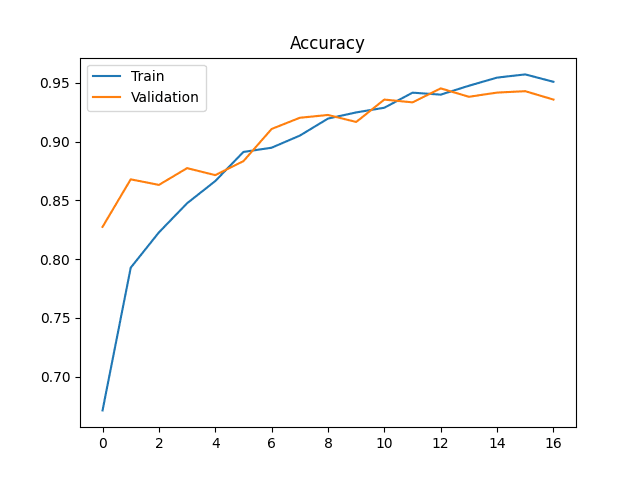
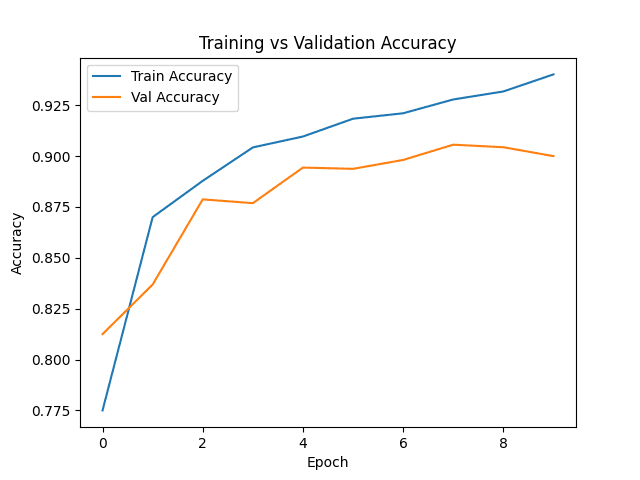
Model 1 Accuracy
The baseline CNN learning curve establishes the control condition.
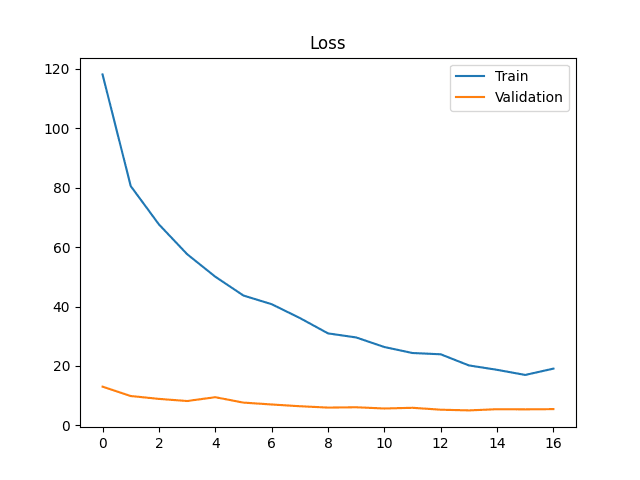
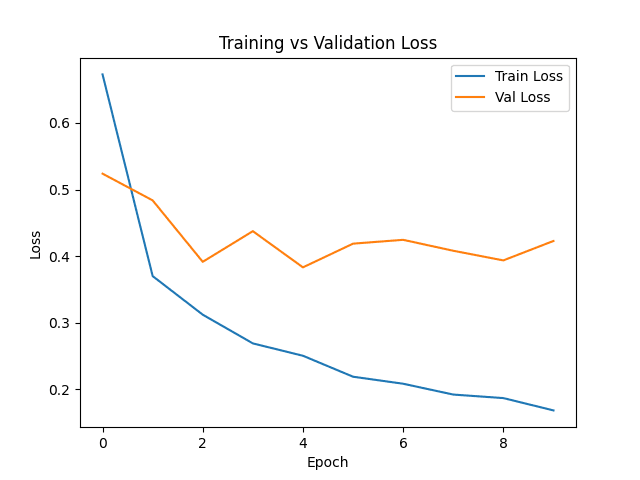
Model 1 Loss
Loss behavior for the scratch CNN before final evaluation.
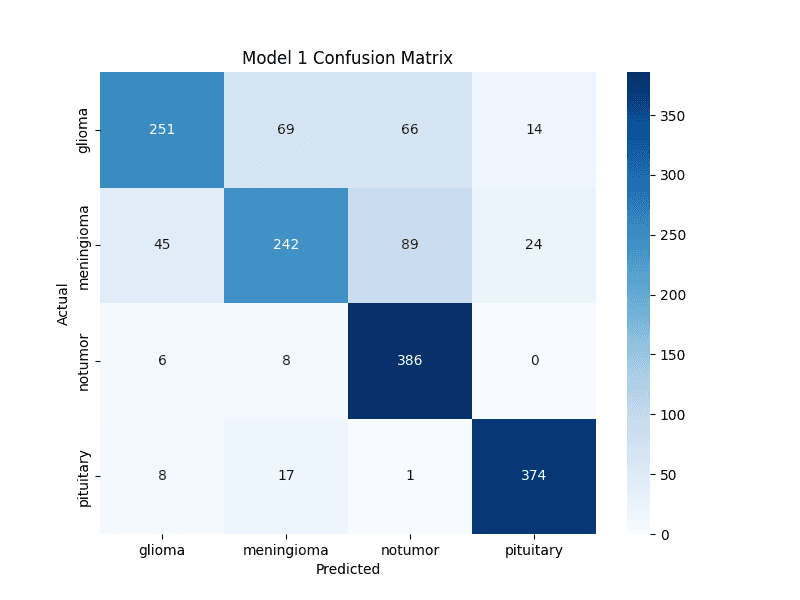
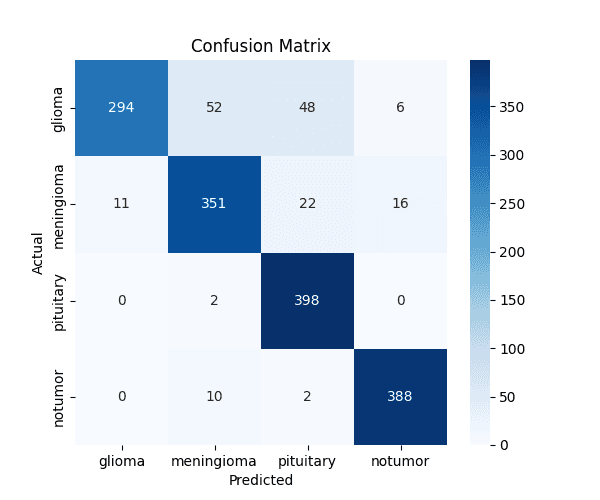
Model 1 Confusion
How the baseline separates the four MRI classes.
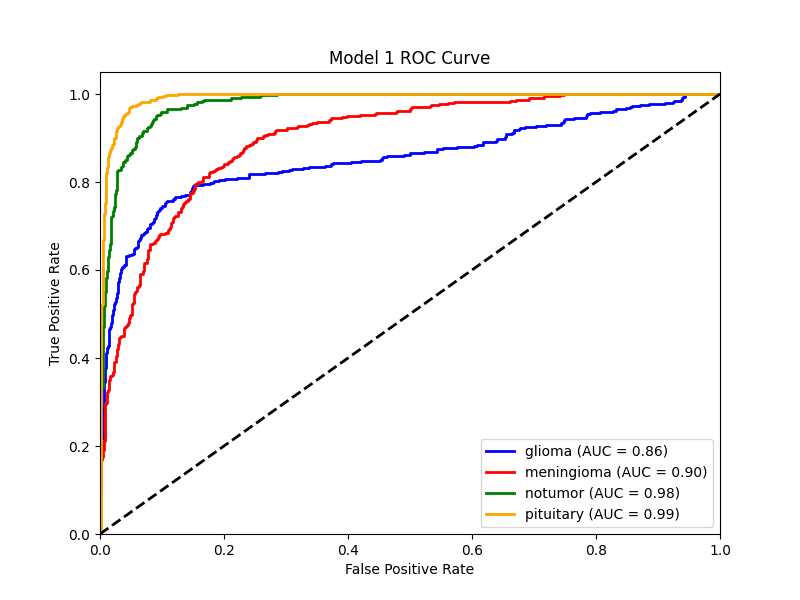
Model 1 ROC
Class-separation curves for the baseline model.
Model 2 Accuracy
The advanced model shows stronger late-stage validation behavior.
Model 2 Loss
Loss stays tighter under the stronger advanced training recipe.
Model 2 Confusion
Confusion matrix used to audit the advanced model.
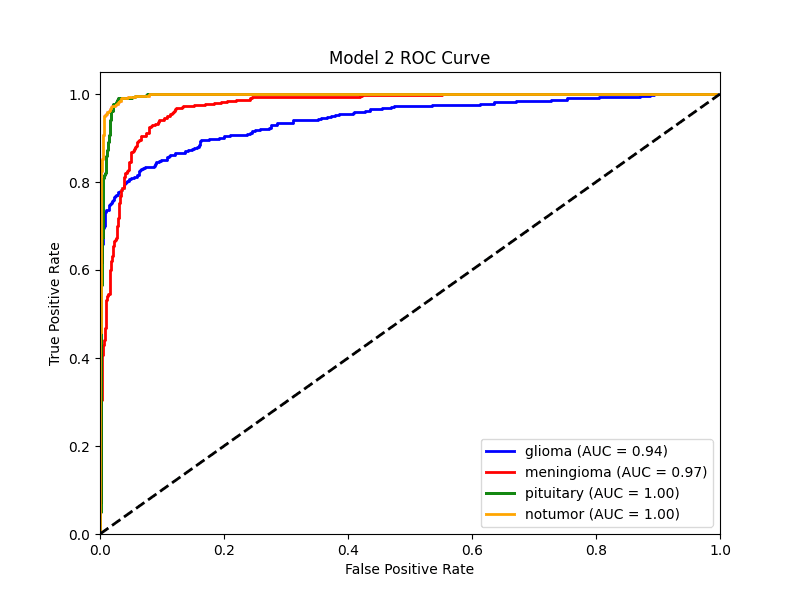
Model 2 ROC
ROC curves give a class-wise view of separation quality.
The live Streamlit demo completes the project.
This page now explains the project clearly on its own, but the live app lets anyone verify the experience directly: upload a scan, compare models, inspect uncertainty, and open the Grad-CAM view.
Streamlit UI
Navigation-driven interface for Home, Upload, Comparison, Grad-CAM, and Research.
Shared Engine
One inference engine standardizes preprocessing and runs both models under the same conditions.
MC Dropout
Uncertainty is estimated through repeated forward passes instead of guessed from one output.
Grad-CAM
Visual overlays make the advanced model inspectable by humans and stronger for presentations.
Evidence
Plots, confusion matrices, ROC curves, and comparison views keep the work research-backed.
Tech Stack
PyTorch, Torchvision, Streamlit, Plotly, PIL, and OpenCV power the application end to end.